Drone Comparison
by Alex Mohr
The three drones I chose to compare are all made in Shenzhen, China, but for different companies. All are quadcopters (4 rotors) with a 6 axis gyro stabilizer which allows them to move in every direction as well as perform 360 degree loops (there is a one touch feature). They all have wifi capability so they can be used with a smart phone, and although the mini has no LCD screen, it does have a fold out phone dock. The screens are all First Person View which allows for flying through the “eye” of the drone. Interestingly both the mini and the largest model compared have one touch return buttons while the mid-range drone does not.
Part 107 of the Federal Aviation Regulations covers the rules for drones. Here are a few: Altitude limit of 400ft unless within 400ft of a building, then it can go higher. You cannot fly at night (even though most drones have led lights), and the drone must be in sight at all times, either by you or a visual observer with you.
Chart outlining basic specifications:
FQ11 Minicopter V66Quadcopter AP10 Quadcopter
Cost $30 $100 $500
Range 30 to 50 meters 150 Meters 500 meters
Speed No data approx 15 -20 mph 45 mph
Flying time 7 to 10 minutes 7 to 10 minutes 25 minutes
Charge time 60 minutes 90 minutes 90 minutes
Weight 40 g 2 kg 3.2 kg
Dimensions 9.6 x 9.6 x 2.9cm 30 x 30 x 6.5cm 37cm x 37cm x 14cm
Camera 0.3 megapixel 720p HD at 30 FPS HD 16 megapixel
& 5.8G Video & 1080p Video
The FQ11 drone is closer to a micro than a nano. Stored inside the controller with the dock folding over as a lid, it is small enough to be carried in a pocket. Although no top speed was listed, the reviews commented that it can fly very fast, however the yaw is very touchy and it was recommended that this drone was not for beginners. There is a cheaper version with no camera.
The V666 controller is quite sophisticated, having separate camera controls, two LCD screens with readouts for altitude, speed, angle, and camera FPV. The blades have protective rings around them which helps to minimize possible damage as the drone can drop out of the sky when the battery gets too low. It uses anti-vibration mounting and there is a place to attach another camera. Some pilots have removed the rings in order to make the drone lighter and faster
The AP10 comes with an FAA warning as this drone can fly to altitude of 500m! It’s top speed of 45 MPH allows for use as a racing drone. It also has a tilt camera lever, something the others do not possess. A nifty GPS-based autopilot with a return to home feature allows for route programming. For additional $100 you can buy a range extender to get wi-fi up to1000ft. Overall this model gives you the most for your money out of the three.
Drones that were flown to an illegal altitude:
DJI F550 Hexacopter crash after flight above the clouds- https://www.youtube.com/watch?v=GfxdeRx2fLA
DJI Phantom 2 piloted to a height of 3.4 km-
Links to referenced sites:
Alibaba.com, warehouse and distribution center for global products.
FQ11- https://www.amazon.co.uk/FQ777-FQ11W-Foldable-Quadcopter-Makibes-Silver/dp/B01HRA0C9E
AP10- http://provideotoys.com/aee-toruk-ap10-quadcopter-review/
FAA- https://www.faa.gov/news/fact_sheets/news_story.cfm?newsId=20516


AEE Technologies AP 10
Multispectral Analysis
by Alex Mohr
The electromagnetic spectrum is the array of all light waves, from radio to gamma. Humans are only sensitive to the wavelengths in the visible light range. When light hits an object it is either absorbed, transmitted or reflected. When the human eye “sees” the color green, that is the wavelength being reflected.
However, in order to study data from bands in non-visible frequencies, it must be converted to colors, or bands, that are visible. Landsat data commonly used for analysis uses bands 1, 2, and 3 for blue, green, and red, with 4 being infrared. For instance, in order to easily see vegetation in an image, band 3 is swapped for band 4, the infrared band. Vegetation greatly reflects infrared, making it appear red when the layers are combined. Here we have an image of Houston, Texas, done is true color and in false color using the infrared bands.
It is possible to combine the bands in many ways as to highlight different features, so while you may not be able to distinguish a maple from an oak, you can tell healthy vegetation from poor.


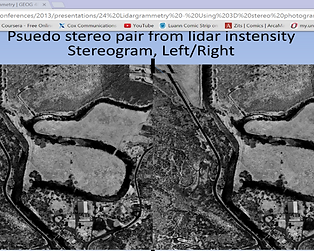
Lidargrammetry
Back in the early 2000’s a geospatial software development company called “GeoCue” came up with a way to use lidar data with photopgrammetry. They developed a technique that uses the standard workstation for photogrammetric processing, but displays stereo pairs of lidar intensity images so the finished product will be more accurate. Typically, the human operator will visually ensure elevation by clearing the x-parallax, using the marks at the bottom of the page to guide them. These marks must stay fused when in stereo view. Additionally, other marks may be made to verify the photo position on the table. When checking a new elevation, the operator can double check the x axis on each screen to ensure the photos are still lined up correctly. When lidar data is used it basically eliminates any uncertainty caused by human interpretation. The operator can also make manual edits to the lidar data if needed, further enhancing the quality of the end product.
Note the older computer and the 3-d glasses. Having lidar data added also helps improve efficiency and lower the need for down-time.
←
This photo shows a bare-earth lidar image of John Day Dam. The far picture has no breaklines, the lines plotted along points that show abrupt changes in elevation (e.g. walls, cliffs). The near picture has used the lidargrammetry data to help place the breaklines correctly.
The biggest problem with lidargrammetry is data storage, as Lidar produces a tremendous amount. Compression has been the usual way to get around the issue, but ITT VIS, the people who created ENVI software, came up with a different solution. They use pre-processing and visualization to avoid the data storage almost completely. This was fortuitous as NASA developed a lidar scanner that fires at a rate of 32,000 pulses a second and then detects individual photons reflected back. “In this way, the lidar creates a 100-pixel, three-dimensional image with every pulse, which is then integrated into a contiguous, high-resolution image by an optical scanner matched to the aircraft’s ground speed” (NASA). This is how we get less than a centimeter accuracy. Clearly lidar sensors are still improving and so the technology to turn all that raw data into meaningful images must also continue to improve.
References
Nasa (2010), Single-photon Lidar Maps Ground Features Quickly, Efficiently.
https://spinoff.nasa.gov/Spinoff2016/ps_6.html
Imaging Notes (2010), Beyond Terrain Models: LiDAR Enters the Geospatial Mainstream.
http://www.imagingnotes.com/go/article_free.php?mp_id=204
Schuckman, Karen, Renslow, Mike (2014) Pennsylvania State University
https://www.e-education.psu.edu/geog481/l5_p5.html
Smith, Doug (2013) Washington Gis Conference, Lidargrammetry: Using 3D stereo photogrammetry for lidar quality control and feature extraction.http://www.waurisa.org/conferences/2013/presentations/24%20Lidargrammetry%20-%20Using%203D%20stereo%20photogrammetry%20for%20lidar%20interpretation%20and%20feature%20extraction.pdf
Stereoscopic Parallax, Center for Photogrammetric Training, Ferris State University
http://www.franzysgeo-place.yolasite.com/resources/Stereoscopic%20parallax.pdf